Max out your System With JMeter
March 07, 2022
Load testing your software can be like a public bathroom (though hopefully cleaner). after a plumber is done setting up 5 toilets, they might go up to each one individually and flush it, see that they all work and be happy about a good days work. After some time goes by, eventually you will have two people just happen To flush at the same time, leading to a real crappy situation that you might be stuck cleaning up.
Whether you have a dozen or hundreds of thousands of users hitting your system every minute, it is good to know the load your system can handle. Just doing functional tests might not surface problems that could occur when many users use your product concurrently. Things like memory leaks, cpu usage and response time might be spot on when one request at a time is occurs but with 1000s of users these problems can quickly become apparent. If your product happens to go viral on the internet then you also want to ensure that your environment can scale accordingly. This is the whole point of load testing.
For load testing, this is where JMeter can be handy. JMeter is a free open-source tool that allows you to write scripts that make a specified number of API calls at a particular interval. This is an especially simple way to load test your backend systems and simulate 1000s of users using you system at a time.
JMeter Setup and Use
JMeter install
- Download JMeter file from here.
- If you have a Mac or Windows get the Zip file and extract it to a directory.
- Open your terminal or powershell, go to the directory you downloaded the file to, go into the bin folder of the JMeter directory to downloaded and and run the following command:
sh jmeter.sh
- The UI for JMeter should now show up.
Note: The UI is not for the actual load test.
Single call JMeter script
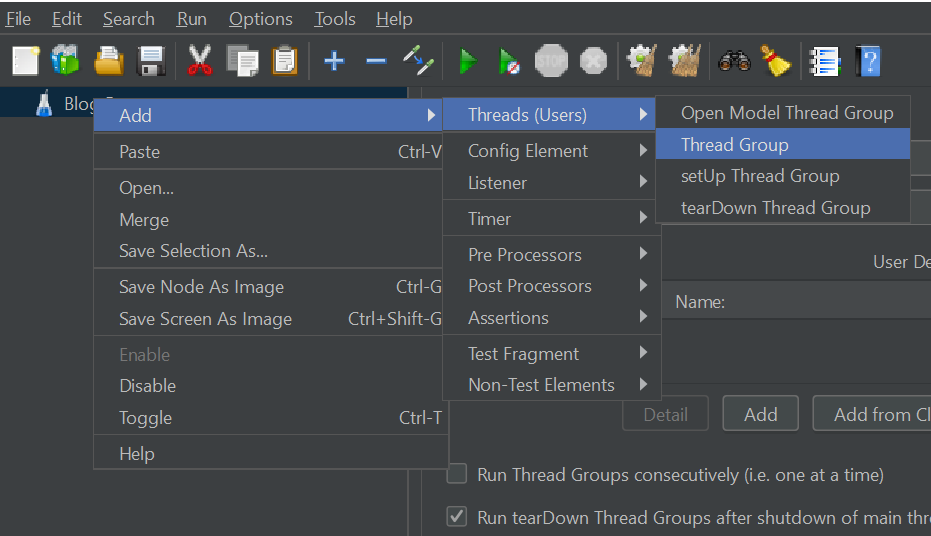
- Create a thread group. Here you can specify the number of thread (users) that you will be running, how long the ramp up will be and how long the entire test will last.
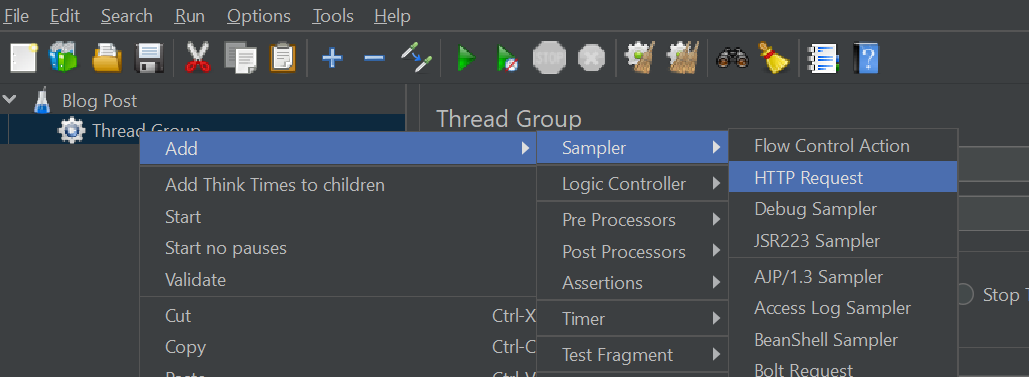
- Add an API call to the thread group.
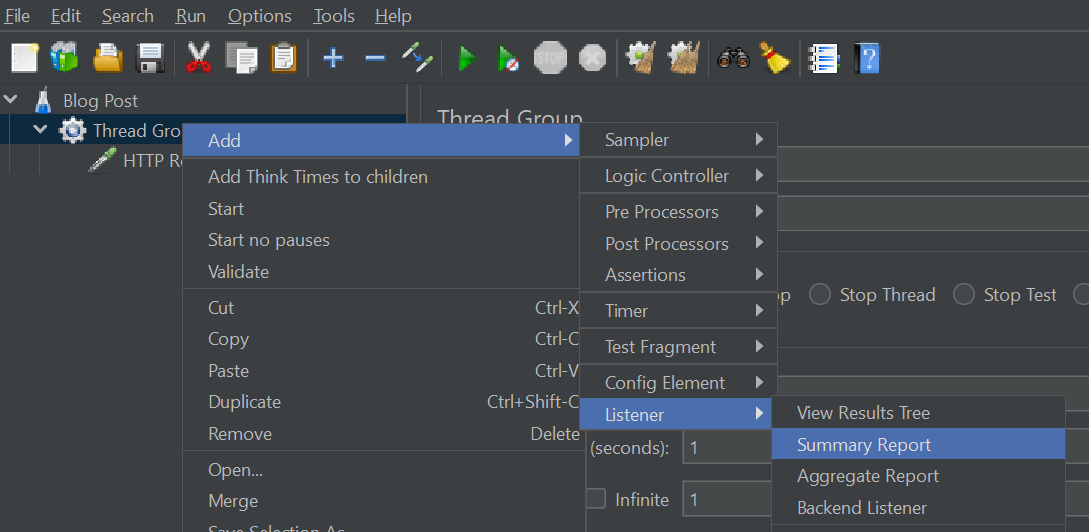
- Add ways to display results (called "Listeners") for small tests that are under 1000 users
- There are quite a few options for listeners but the main ones I use are "View Results Tree" and "Summary Report".
- View Results Tree just shows a list of which individual calls failed or passed and if they got redirected or not.
- Summary Report just shows aggregate results of all the calls made.
- If you have good telemetry and logging on your systems then this might not be needed.
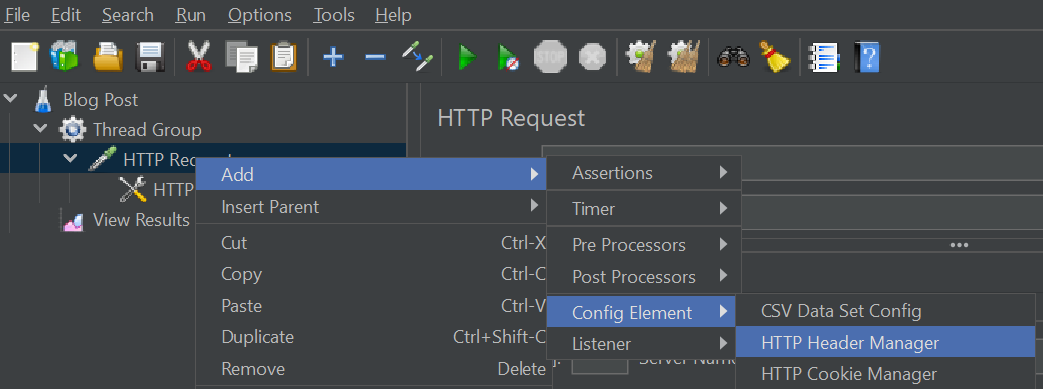
- Add headers to request if needed. First add the header configuration element then add the actual keys and values you want as headers

- Add Assertions for response
- Using assertions, you can ensure that what is returned from the call is what is expected. For instance, if in the top level of the JSON response you expect a data attribute then you can ensure it will be there with "
$.data" and if the call passes in JMeter then the data attribute is there. - The assertion element should be a child of the request element that it will be used for.
- Using assertions, you can ensure that what is returned from the call is what is expected. For instance, if in the top level of the JSON response you expect a data attribute then you can ensure it will be there with "


Double call JMeter script
To add another call to the test, you can either duplicate the one you have before or create a new one from scratch like in the earlier steps.
- Note that every thread (or "user") will run both of these calls in order and as fast as possible
- For the example below, this single "user" will make "HTTP Request 1" then immediately make "HTTP Request 2"

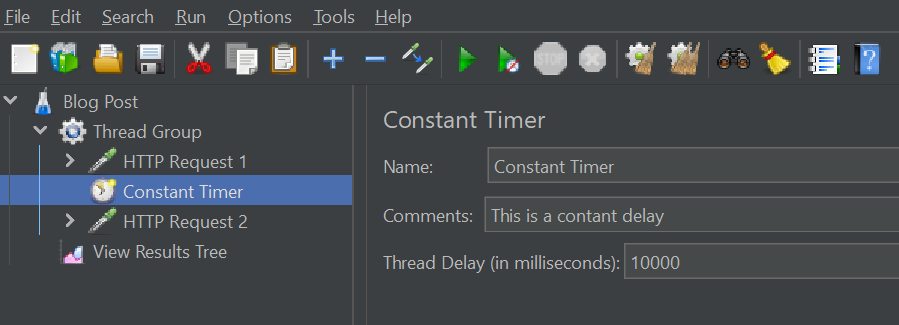
To simulate a more realistic user you can put a delay in between the two requests. This can be done with different timers, the simplest of which is the "Constant Timer" and is shown below

With this constant delay in place, a single user will make the first HTTP request, wait 10,000 milliseconds(10 seconds) then make the second request.
This is just a basic setup to get you started. There are many more settings, elements and variations of all of these and those can be found in the JMeter documentation here
Specifying Users, Ramp up and Duration
For load testing, the most important part of the script is the actual number of users and duration of the test. In JMeter these settings can be found in the thread group.
Although the definitions of users, ramp up time adn duration are simple it is very crucial to get these right. The number of users is how many times your script will be running. If "Infinite" is selected then that will be one call right after the other as fast as possible unless a delay is put in.
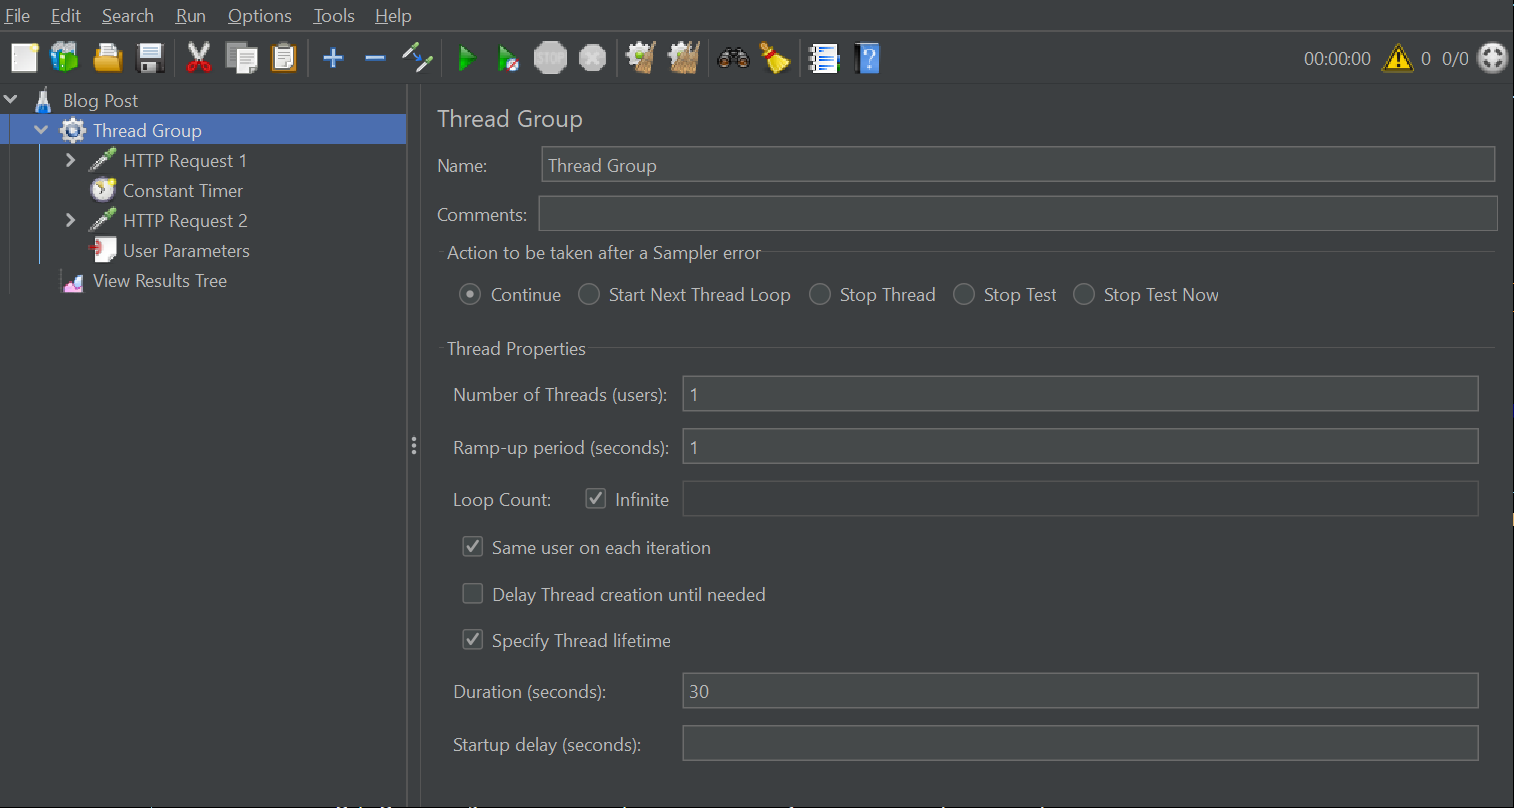
The ramp up time is the duration of time it takes or all your users to start.
- If you specify 10 users and a ramp up of 10 seconds then 1 user will start every second.
- If you specify 1000 users over 5 minutes (300 seconds or 300000 milliseconds) then 1 user will start every 1/3 of a second. For the duration, this is how long the entire test will run, including the ramp up time. So if you have a ramp up time of 300 seconds with 1000 users and the duration is 600 seconds (10 minutes), then the script will take the first 5 minutes to ramp up to 1000 simultaneous users then those 1000 simultaneous users will run for another 5 minutes.
Mort information on this can be found in the JMeter documentation here
Using Variables and Functions
There are ways to use random numbers, variables and functions to simulate more realistic data. Variables can be created with different elements such as the the "User Parameters" element. With this you can define variables and reference them elsewhere in the script by wrapping the variable with ${some_variable}.
Along with variables, there are also built in functions that can be used with those variables. For example, the __time function can be used to return the current time in milliseconds. It can be referenced like the following:
${__time(EEE\, d MMM yyyy)}
There are many more uses for variables and many more functions so if you would like more info then it can be found here.
JMeter Command-Line Interface (CLI)
Depending on your system, you might be able to use JMeter on a normal computer without the use of a third party tool, such as Flood.io. If you have no need for multiple IP addresses and you want to run 3000 users (threads) then you can probably get away with just using the JMeter CLI. Of course, work your way up to 3000 if you have never load tested your system before. Start at 100, then go to 200, then 400, 800 and so on. Eventually you will want to use Flood.io so as not to overwhelm your computer.
Before running the script using the CLI, deleting any "Listener" elements will make your script run smoother and more consistently.
To run JMeter without the use of the UI, which can cause slow downs if running an actual load test, you need to follow these steps:
- Open a terminal and go to the bin directory of the jmeter tool
- If you have good telemetry for your systems and do not need the JMeter script to save anything for you then you can simply run the following command
For Windows:
.\jmeter.bat -n -t .\blog_post.jmx
For Mac:
sh ./jmeter.bat -n -t blog_post.jmx
- The
-tflag specifies the filename of the saved test plan, where ever that might be on your computer - The
-nflag specifies "Non-gui" which means you will be launching the test from the terminal and not using the JMeter UI
- If you do need to save the results then that can be done using the
-gand/or-e -oflags.
For Windows:
.\jmeter.bat -n -t .\blog_post.jmx -e -o .\report\ -g report-file.csv
For Mac:
sh ./jmeter.bat -n -t blog_post.jmx -e -o .\report\ -g report-file.csv
- The
-e -oflags specify a directory that an HTML report dashboard will be generated in. It will look nice and have lots of cool information. - The
-gflag specifies a csv file that all of the individual request info will be saved to in case you need that.
- After running your test either open the HTML file in the directory or play with the csv file and see your results!
There are many more CLI flags that can be used so if you want to know more then they can be found here
Finding the max load of your production system in a testing environment.
-
If your infrastructure runs on docker, as a lot do, you might have a different number of instances running in your production environment than in the test one.
-
Make sure the instances can be scaled and that they are scaled off the right metric. If you have a small internal service that does a small bit of validation then the limiting factor for that instance might be throughput rather than cpu usage.
-
You database connection limit might not match your request limit. For instance, if you have a service that makes requests to a db, if it can have 200 network connections open but can only have 10 db connections open, if it gets hit with 20 requests then 10 of those will just wait until the db requests finish. This only gets worse the more requests you get.
-
You might find that instances need to communicate between each other in which case scaling might only cause more complexity and therefore make the system slower. This can especially happen with a CMS.